Tutorial: Querx and ScadaBR
SCADA (supervisory control and data acquisition) is an industrial control system for remote data acquisition and process controlling. ScadaBR is an open source software for SCADA and can be downloaded free of charge. In this tutorial we are going to set up a graphical control interface that will let us monitor temperature and humidity using Querx TH. Other egnite sensors can be set up in a similar fashion.
Step 1: Installing ScadaBR and Logging in
- Download the ScadaBR installer from SourceForge.
- Start the installer and follow the on-screen instructions.
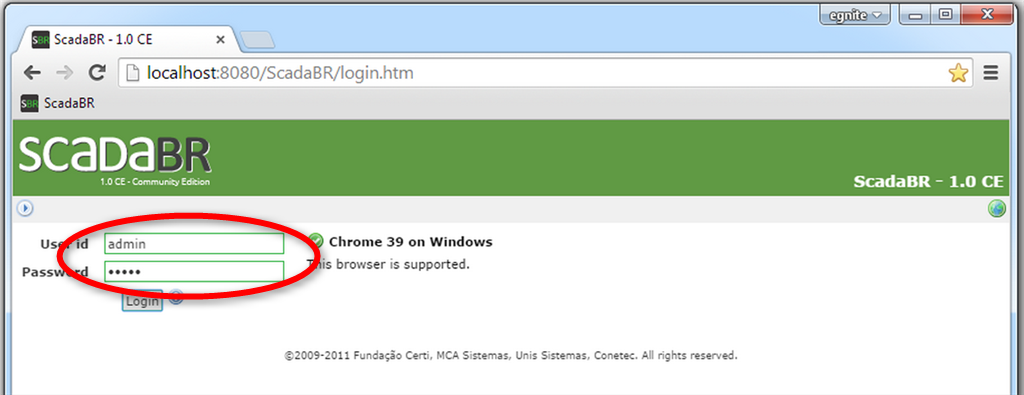
- Open a web browser and enter the following URL: http://localhost:8080/ScadaBR/.
- Now log in to ScadaBR. Both the default User-ID and Password are admin.
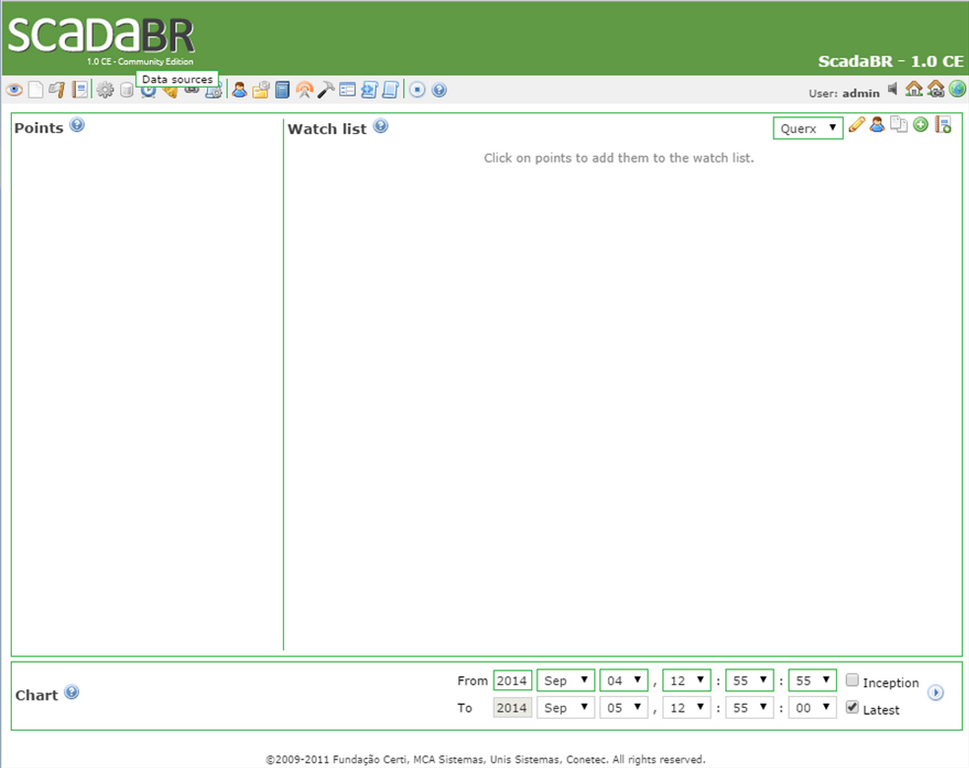
After you have logged in, a page called Watch list will open.
Step 2: Setting up a Data Source and Data Points
Creating a New Data Source
A data point needs to be added, in order to read measured values. The temperature value returned by Querx TH is a 2 byte signed integer with the offset-address 10. Thus, the following data needs to be entered into the Point locator test section:
- Register range: Input register
- Modbus data type: 2 byte signed integer
- Offset (0-based): 10
- Click Read, in order to check if your configuration is valid.
ScadaBR will display a number in the lower left corner of the Point locator test section. This is the current temperature in degrees Centigrade, multiplied by 10.
5If everything works as expected, click Add point.

Now you need to connect Querx TH to ScadaBR. To do so, a data source representing the unit and data points represent the specific measurements need to be added. ScadaBR supports a multitude of interfaces, while Querx TH supports SNMP and Modbus/TCP. As ScadaBR only supports SNMP on a very basic level, we will use Modbus/TCP for the sake of this tutorial.
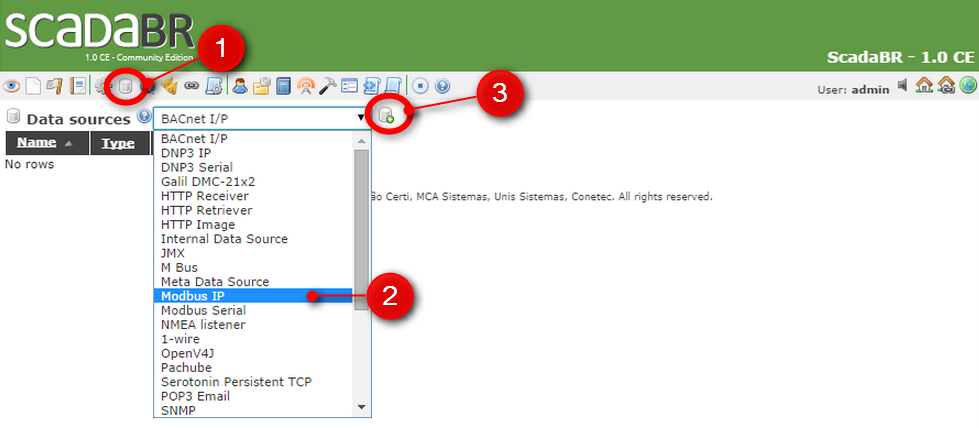
- Open the page Data sources.
- Choose Modbus IP from the drop down menu.
- Click the Add icon to the right of the drop down menu.
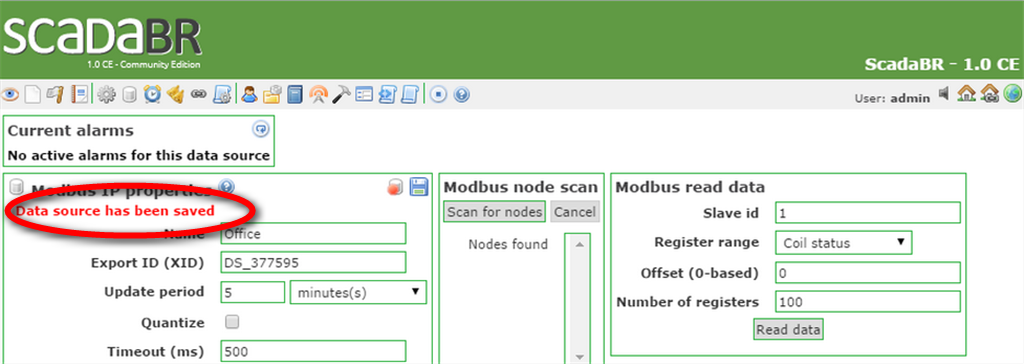
- Enter a Name for your device.
- Enter your device's IP address. The default values for all other settings do not need to be changed.
- Finally, click the Save icon.

You will be notified that your data source was saved.
Adding Data Points
A new form that serves to set up the new data point is now displayed.
- Enter a Name for the data point, in this case Temperature.
- Set a custom Multiplier. To avoid commas, the transmitted values are ten times higher than the actual value. Therefore, the multiplier needs to be set to 0.1.
- Finally, save the new data point.

Now add another data point for the humidity sensor.
- Enter the following settings in the section Point locator test:
Register range: Input register
Modbus data type: 2 byte signed integer
Offset (0-based): 11 - Add the point and enter the following data in the section Point details:
A Name for the sensor, here Humidity.
A Multiplier of 1, since the humidity is transmitted as it is. - Save your changes.

The next step is activating the data source and data point.
- Activate the data point for Humidity by clicking the building block, making it turn green.
- Activate the data point for Temperature by clicking the building block, making it turn green.
- Activate the data source by clicking the data base symbol, making it turn green as well.
- Do not forget to save the device afterwards.

Step 3: Visualizing the Data
Creating a New Dash Board
We will now set up a dash board that can visualize the data provided by Querx TH.
- Click Graphical views.
- Click New view.

- Enter a Name for the new view.
- Select Dynamic graphic from the drop down menu.
- Click Add component to view.
- Now click Edit point component settings.

Adding Dials for Temperature and Humidity
- Now click Edit graphical renderer.
- Enter the value range that you want to display.
- Select SmallDial from the drop down menu Dynamic image.
- Click Save.
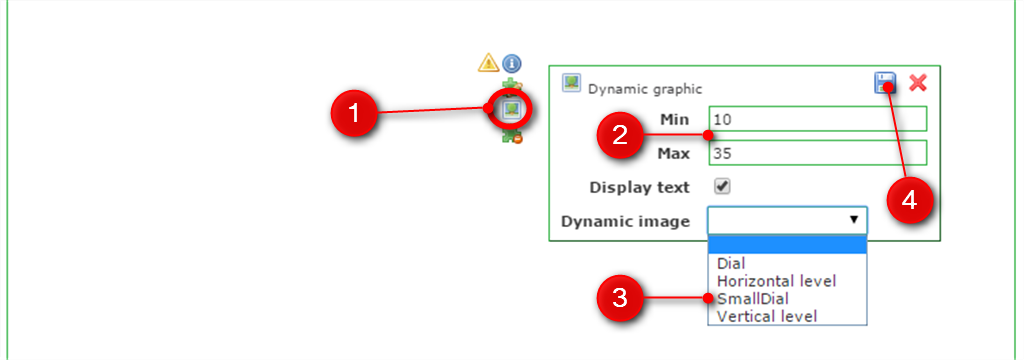
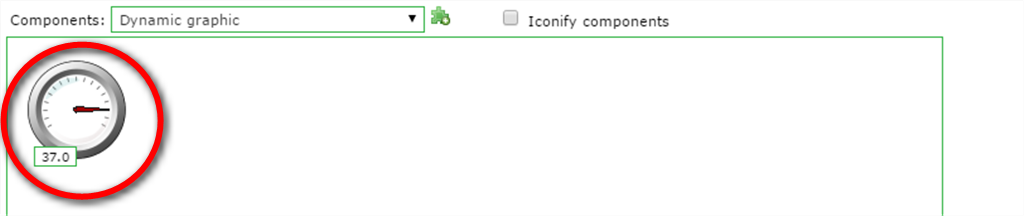
A small dial will now be added to your dash board.
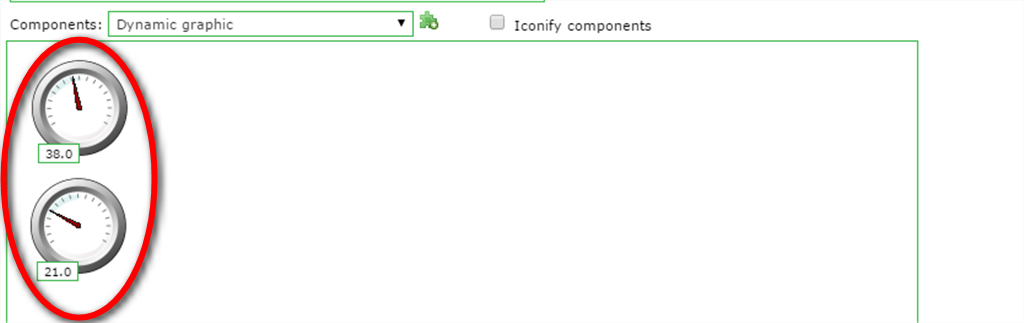
Now repeat the procedure for the temperature sensor.
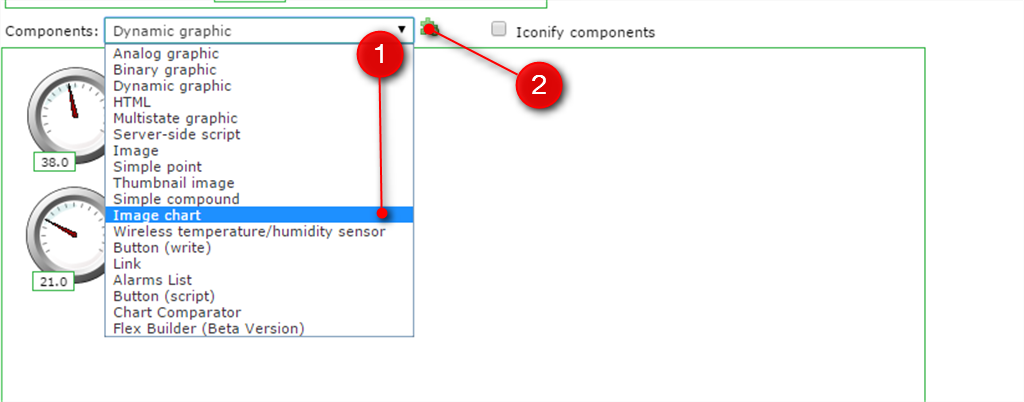
Adding Charts for Temperature and Humidity
- Choose Image chart from the drop down menu.
- Click Add component to view.
- Click Edit point component settings.
- Enter a Name for the chart.
- Set the chart's Width and Height.
- Set the time period that will be displayed in the chart.
- Select the humidity sensor as Point 1.
- Click Save.
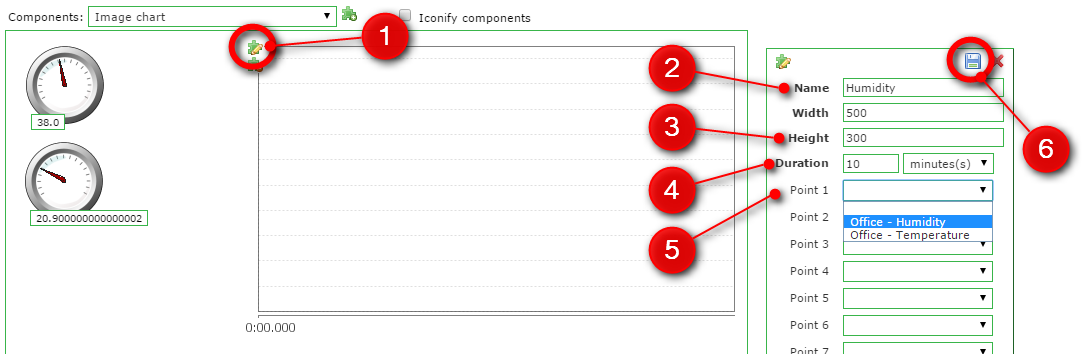
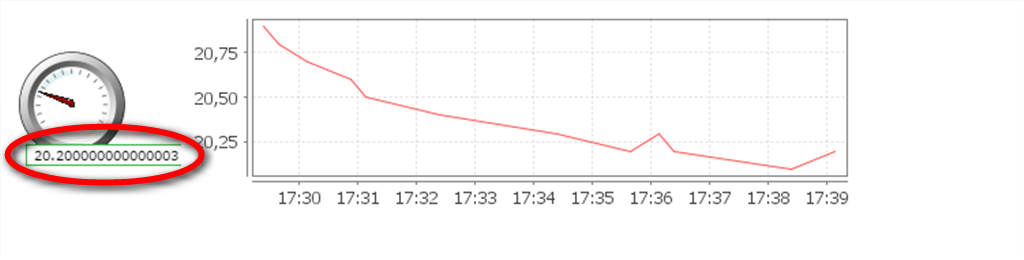
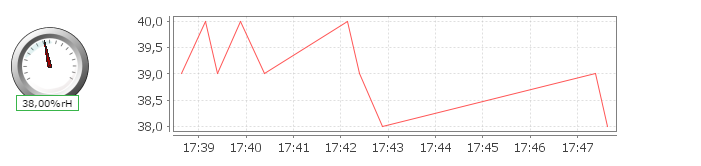
Repeat the procedure for the temperature sensor. The result will look like this:
Click Save.

Step 4: Adjusting the Data Format
You may have noticed that the displayed values occasionally look odd. We can fix this by adjusting the text rendering template.
- Click Data sources.
- Click Show data points.
- Click Edit data point, next to the humidity sensor.

- Select Analog from the drop down menu Type.
- Enter 00.00 in the field Format, in order to set the display to include 2 digits before and 2 digits after the decimal point.
- Enter %rH as the suffix.
- Save your changes.

The format in which the humidity values are displayed has now been changed. Repeat the procedure for the temperature sensor.
Further Information
The Modbus registers that can be used with ScadaBR can be found in each device’s manual. For more information on ScadaBR, visit the project web site.