ⓘ
Palamoa is our cloud service with integrated dashboard and Android app. If you want to learn more about Palamoa, click here.
Tutorial: Cloud Palamoa
This tutorial demonstrates how to connect Querx WLAN TH to the service. In general, however, any network sensor that can transmit data in the JSON format or via HTTP Post can be used with Palamoa. The only differences are to be found in the configuration of the individual sensors. The device should ideally be updated to the current firmware, but at least needs to be running version 4.4.18.
Querx sensors require an active internet connection, in order to transfer their data to the cloud. Should you not be sure whether this connection is operable, please read the first two sections of the tutorial E-Mail.
The web interface is not always updated correctly. Therefore, it is sometimes necessary to refresh the page.
Signing up
Open the page palamoa.de in your web browser.
You need to create an account via the button Register, in order to access the web interface.
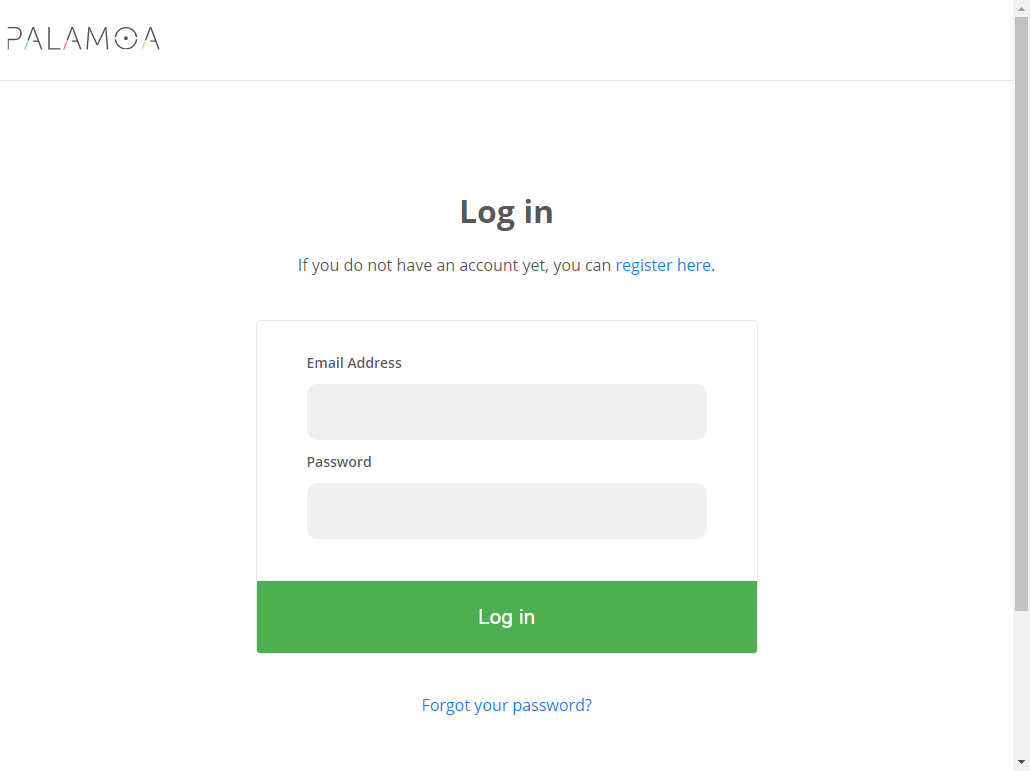
If you have already created an account but are currently not logged in, you can do so by using the Log In button.
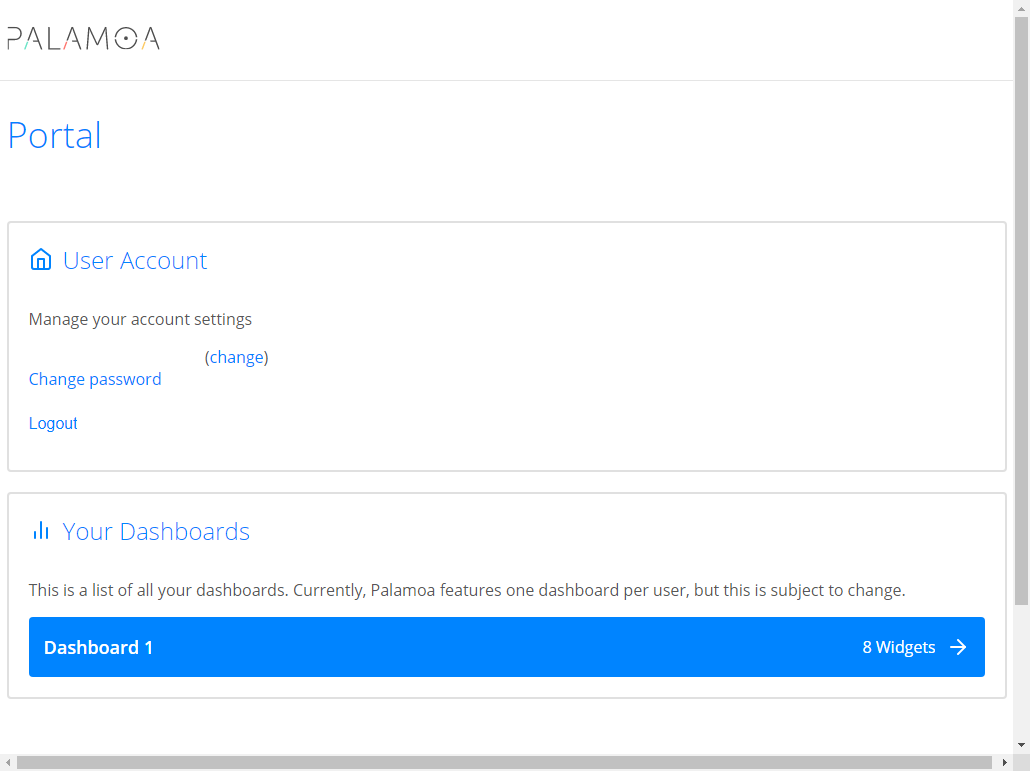
Here you can select the dashboard you want to access.
Configuring the Device
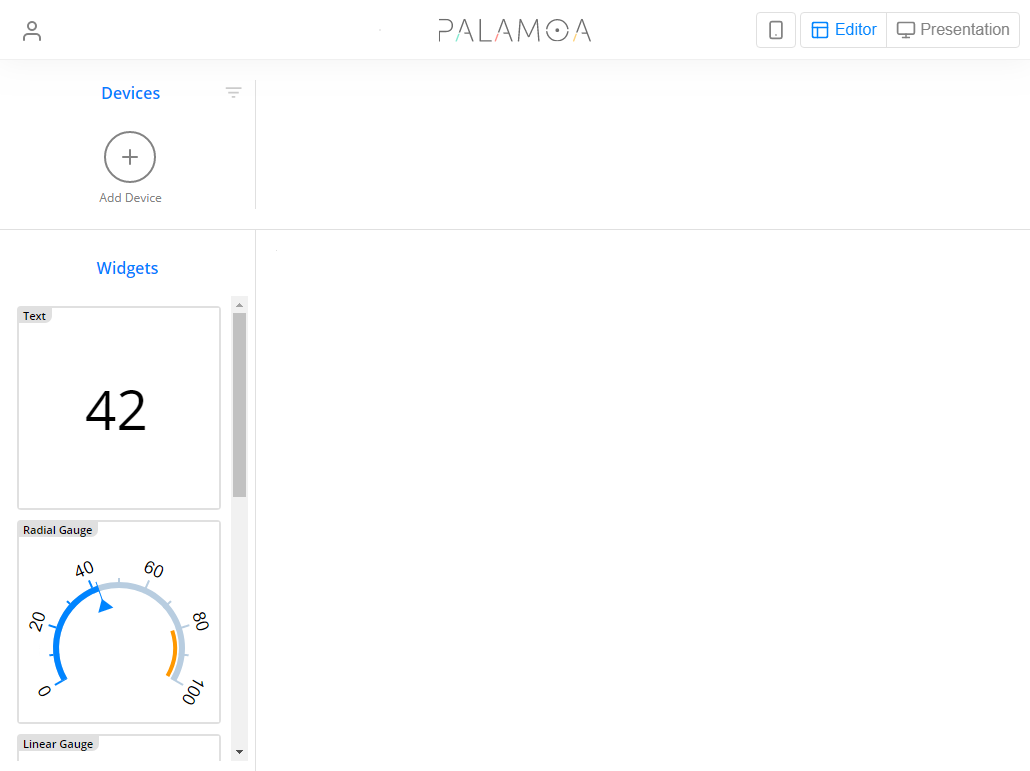
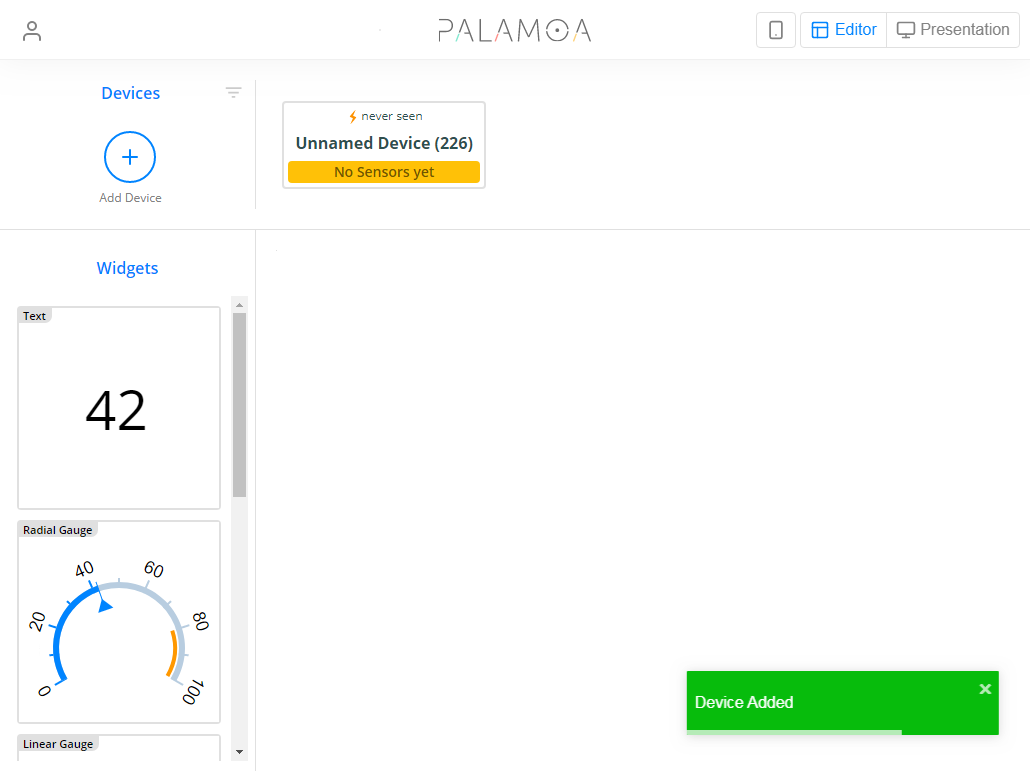
After creating an account, you will see the blank dashboard.
Click the button Add Device, in order to configure a new device.
The header will display a new device without a name or sensor.
Click Unnamed Device.
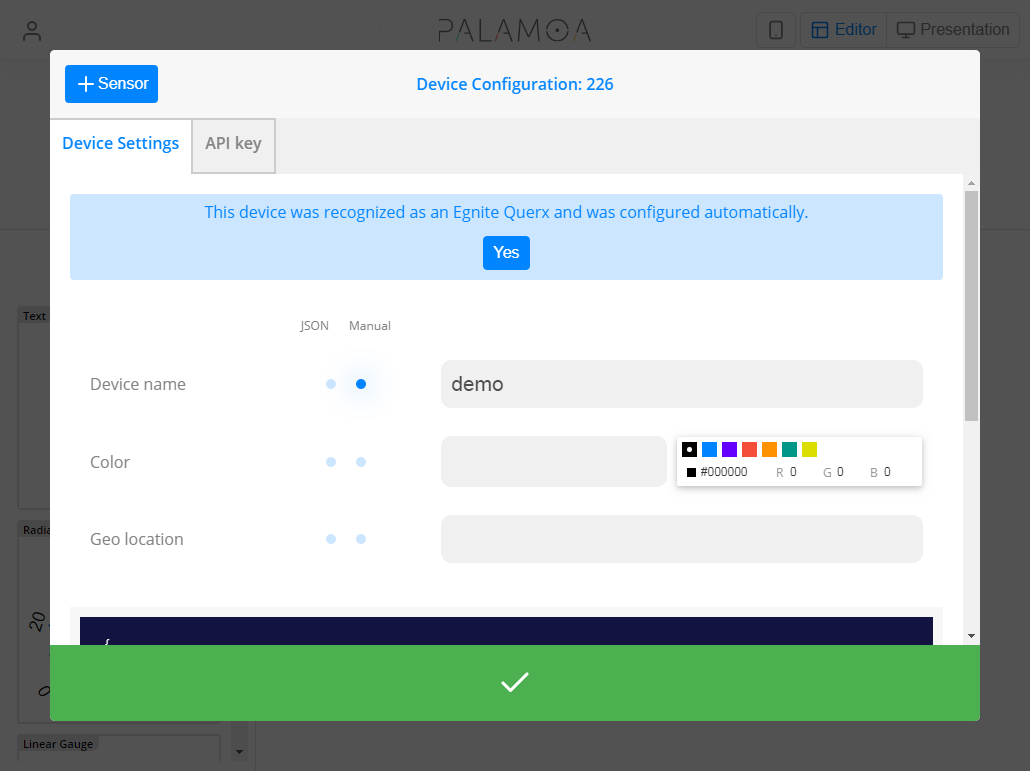
An input field that lets you configure the device opens.
Enter a name for the device.
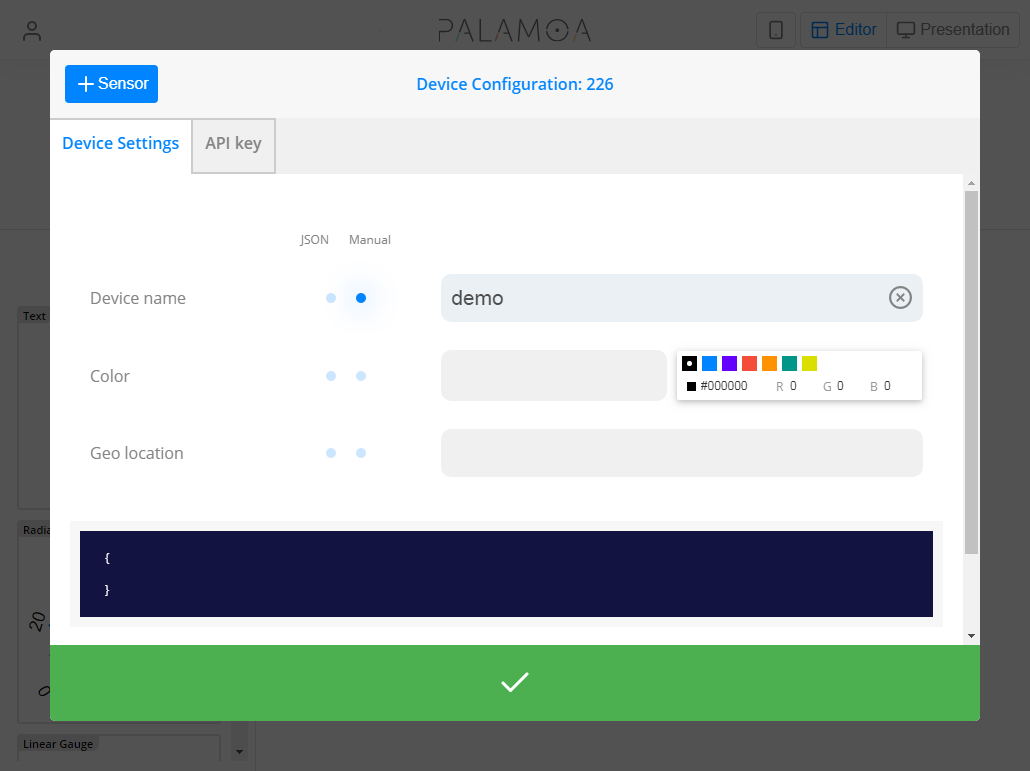
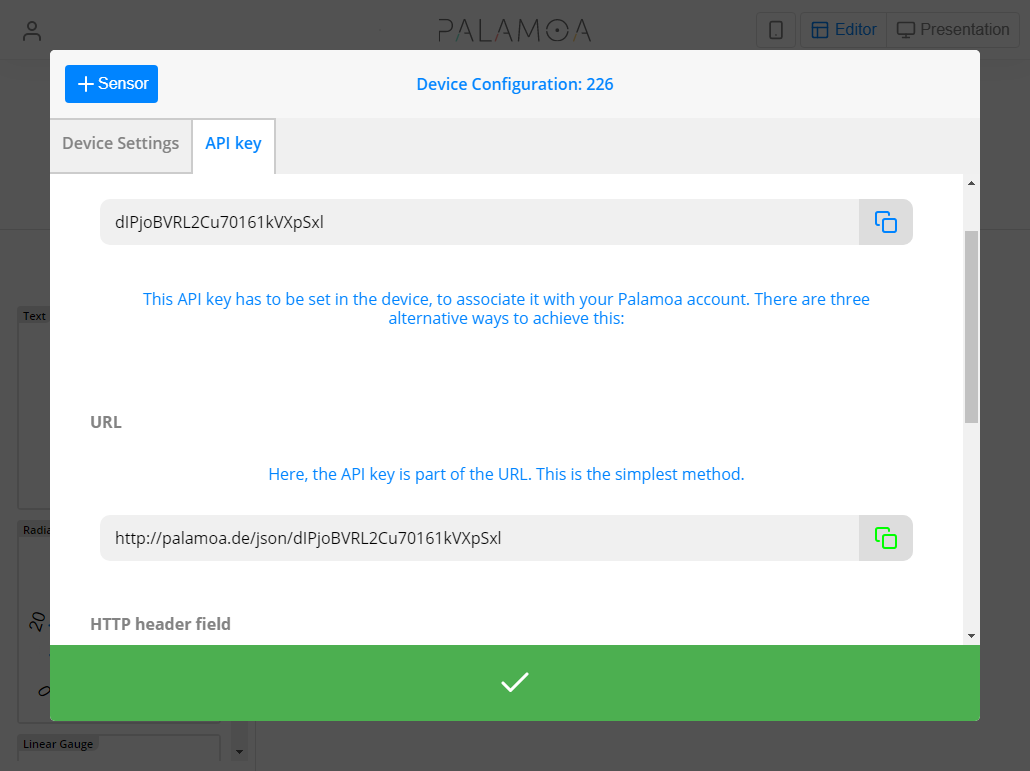
Click the tab API-Key.
Configuring Palamoa in the Querx web interface (from firmware version 6)
Now open the configuration page Interfaces / Actions of the Querx web interface in a new Browser window or tab. Select HTTP Push 1 as action type and Time interval 2 as event type. Now create a new action by pressing the button Add 3.

First, select the name of the template from the list, in this case palamoa.tpl 2. After the selection, some input fields will change. URL and HTTP method will get the value from the template. In the field API-Key or Variable 1 3 enter the API-Key displayed by Palamoa.
The Update rate field 4 determines how often Querx should send the current measurement value to Palamoa. Select in which interval (in minutes) the value should be updated. Enable the action with a click on Enable 1.
To evaluate the configuration, click on the Test button 5. Querx will then immediately send the current measurement values to Palamoa. When the data has been accepted by the other side, the button turns green.

Configuring Palamoa in the Querx web interface (from firmware version 4.4.18)
Should your Querx not run firmware version 6 or higher, but at a minimum of version 4.4.18, please proceed as follows:
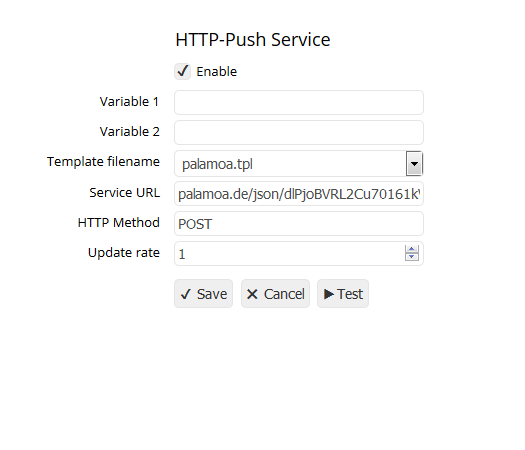
Open the Querx web interface in a new browser window or tab and navigate to the page HTTP Push in the configuration area. Enter URL displayed by Palamoa in the previous step into the corresponding input field. Fill in the other input fields as displayed in the screenshot and click Save.
Querx will now send a set of data to Palamoa once every minute. If you set the Update rate to "0", Querx will send a set of data as soon as the data changes.
If "palamoa.tpl" does not show up in the selection menu then you are using an older firmware version. In this case you can alternatively use "push.tpl". If you use "push.tpl" however, the automatic setup won't work and you will have to set up the sensors manually.
Automatic configuration for Querx sensors
If the configuration of Querx was successful, a dialog that lets Palamoa configure Querx automatically should appear after Querx has sent its first data set. If you click "Yes", Querx will be set up automatically and you can skip the section "Configuring sensors manually".
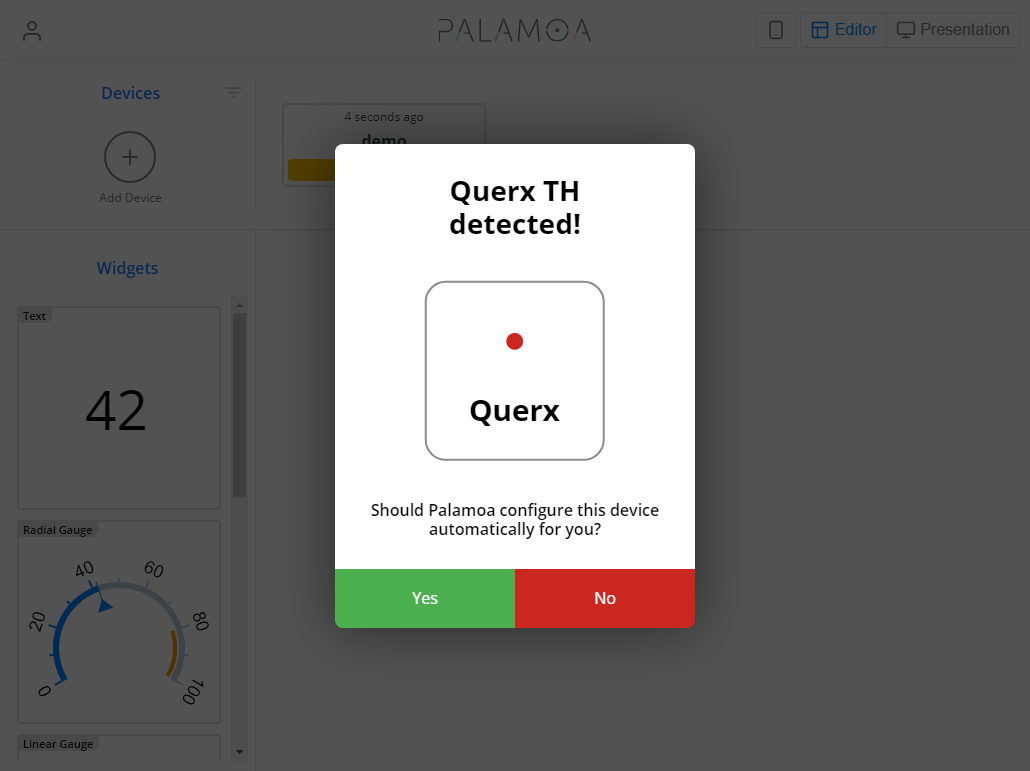
You can also select the automatic setup from the device's configuration menu at any later time.
Configuring sensors manually
A first set of data sent by Querx should appear in the dark field after about a minute.
Once the data is displayed, click Add Sensor, in order to enter a sensor.
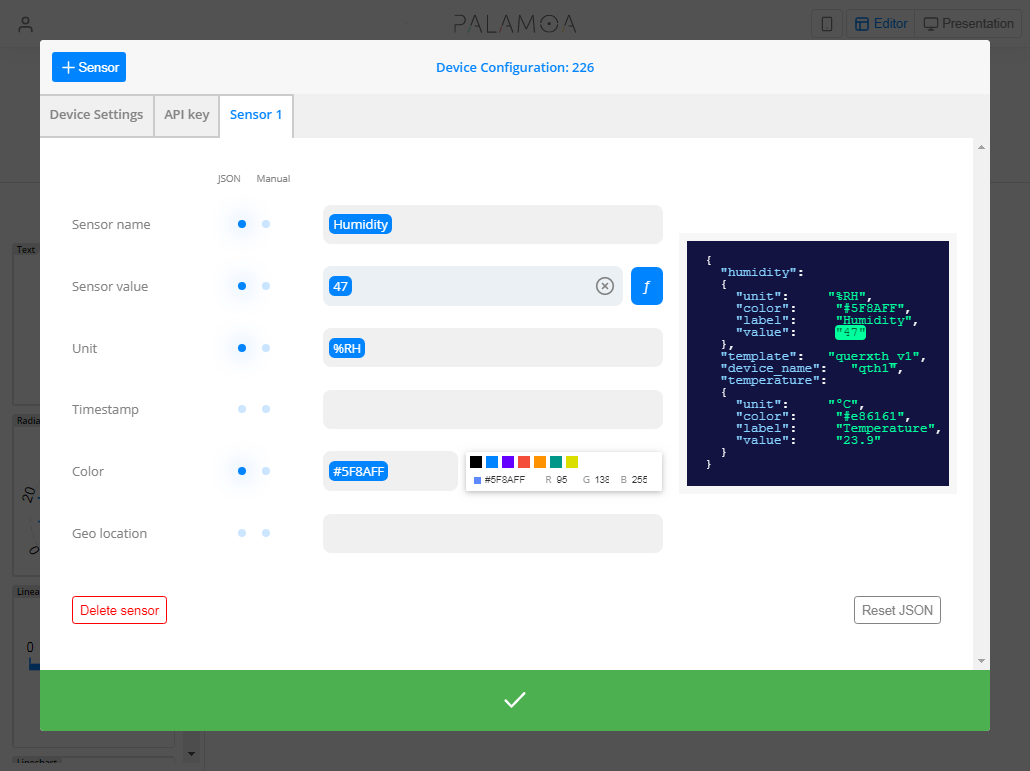
Type the sensor’s name into the input field.
Palamoa is highly flexible, making it able to read various data formats. We need to tell the cloud where the corresponding data is located within the data set. We do this by clicking on the input field Value, thus activating it. We then need to click the temperature value within the data set.
Repeat this procedure for the unit by clicking the input field Unit and then selecting °C in the data set.
Palamoa now knows where to find the data that is required to display the temperature.

When configuring a Querx TH or THP sensor, you can add further sensors. You can close the window once all sensors are configured.
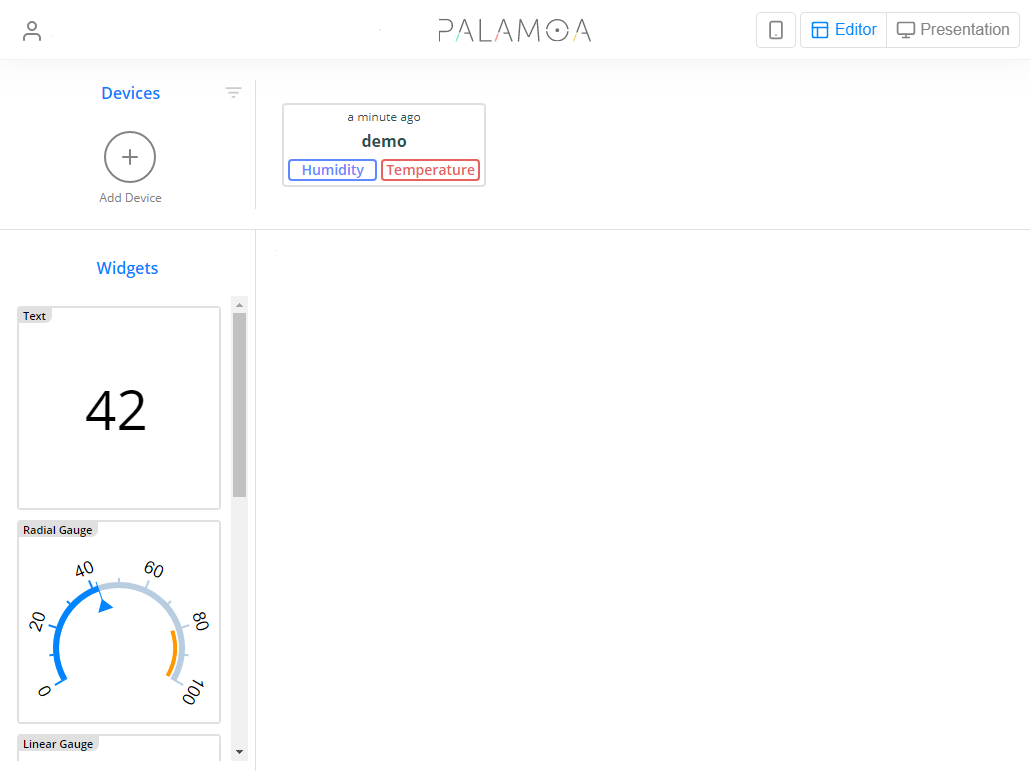
Back on the dashboard, the device appears with the configured sensors.
In the current version it might be necessary to refresh the page for the changes to be displayed correctly.
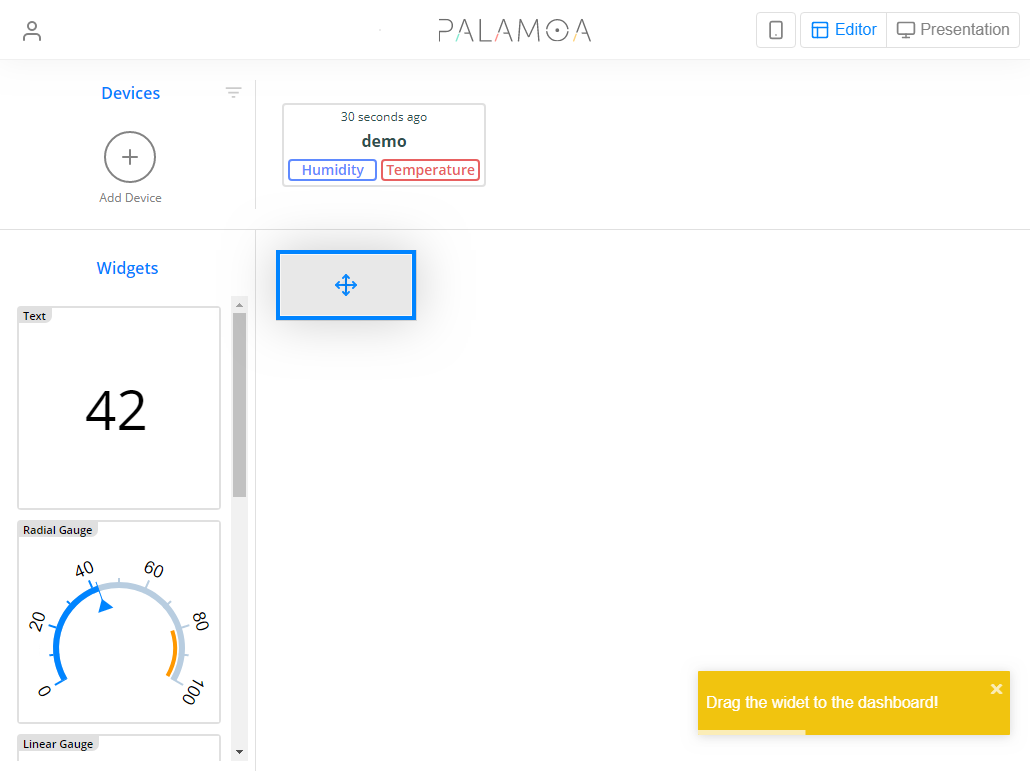
Pull a text widget from the widget list into the dashboard area, using your cursor.
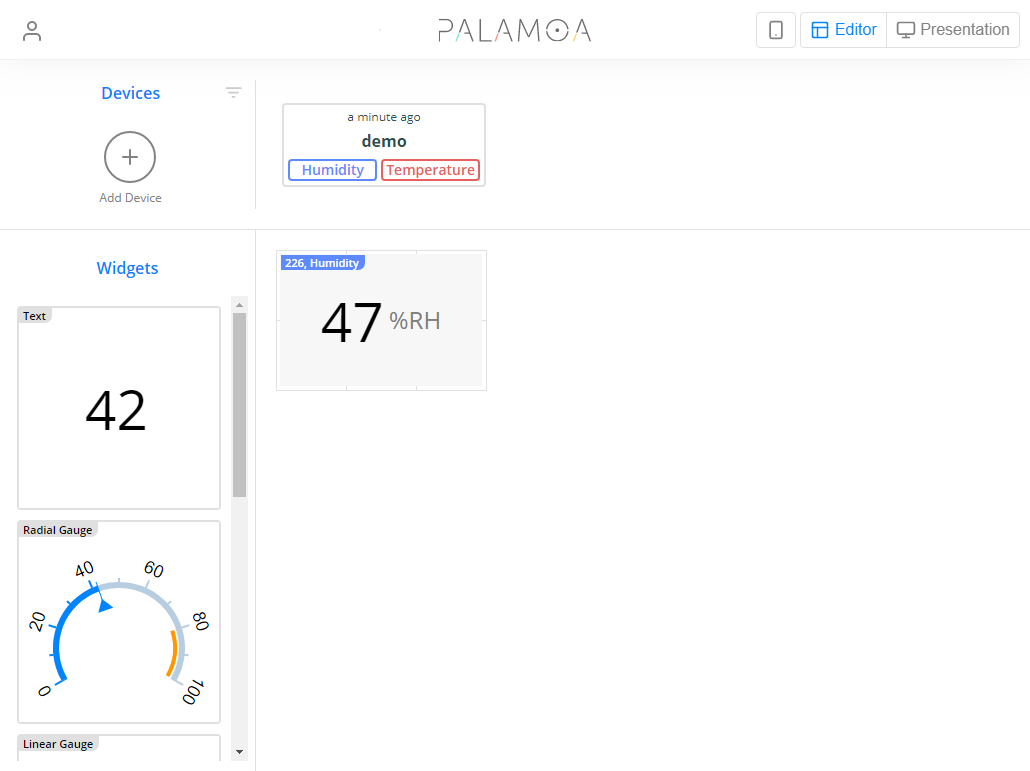
Connect the widget and the sensor.
Use your cursor to pull the device’s sensor onto the widget.

The device’s name, along with the sensor’s name and the most recent value appears in the widget. Congratulations, you have configured your first Palamoa dashboard.
You can now add further devices, sensors and widgets in the same way, in order to further extend your dashboard.

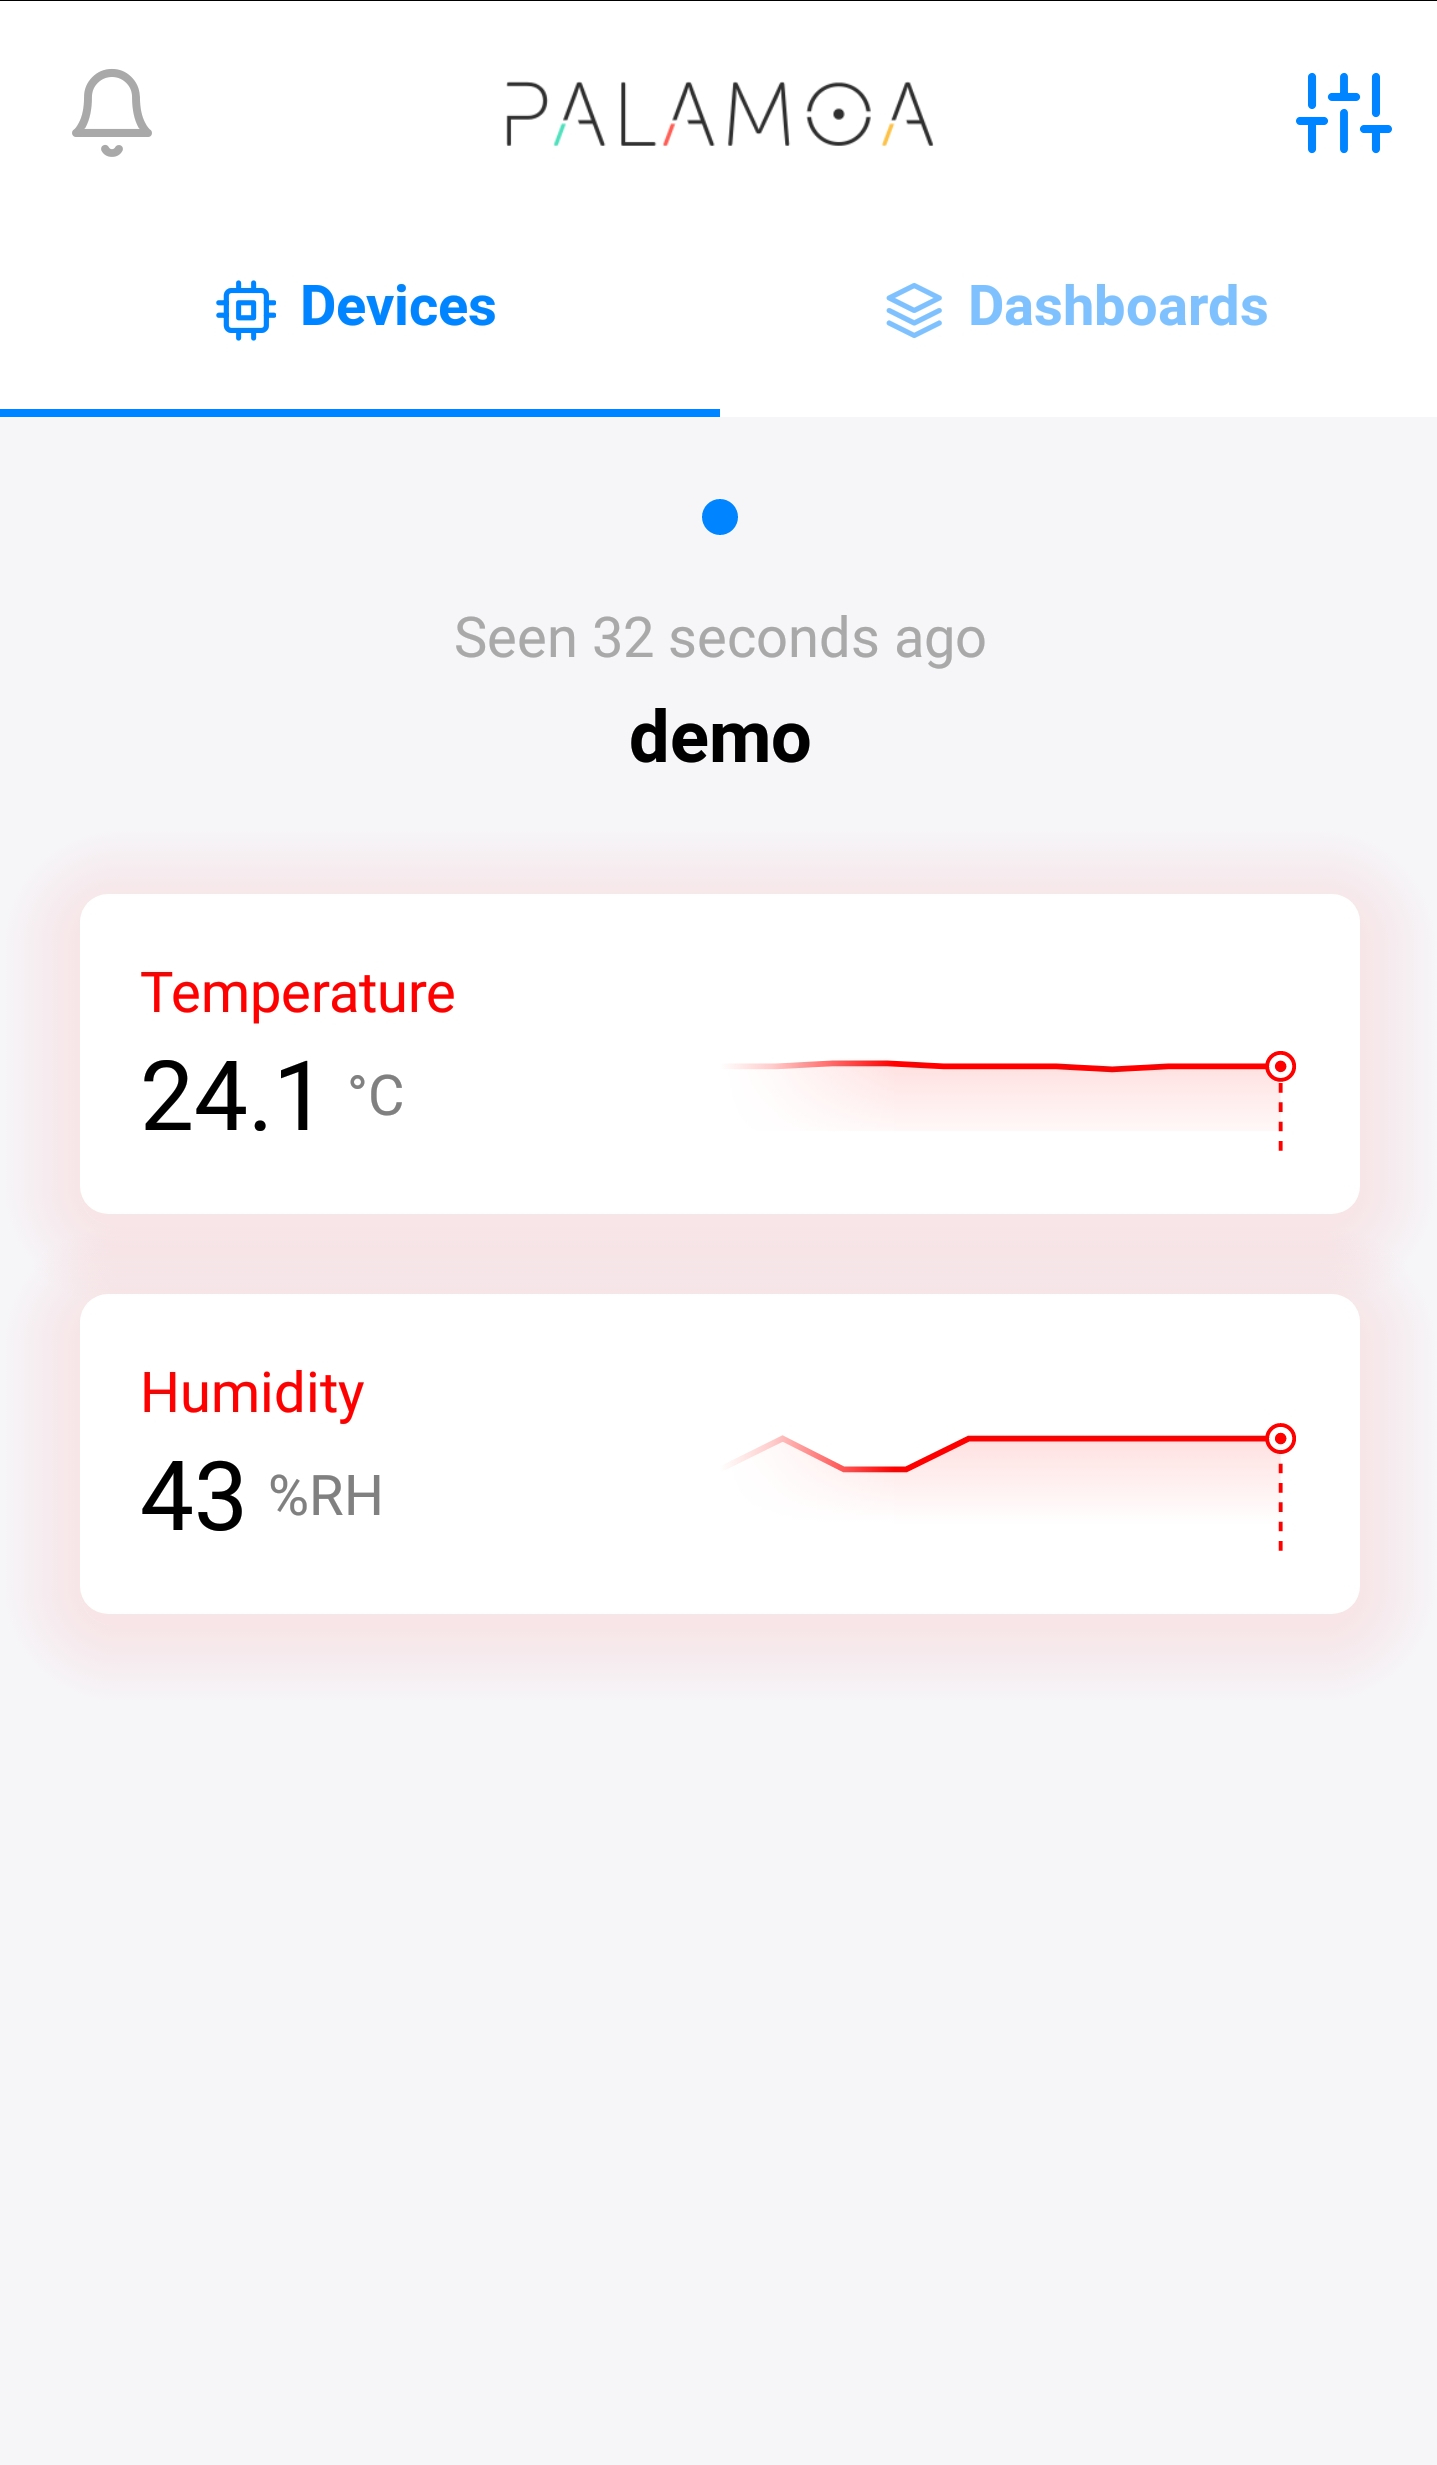
Palamoa App
A Palamoa app that lets you easily monitor your data from your Android smartphone is also available. You can find it here in the Google Play Store. (https://play.google.com/store/apps/details?id=com.palamoa_android).

Instead of having to enter your data manually, you can alternatively choose to log in using a QR code. To do this, simply open the QR Code Scanner in the Palamoa app.

On the Palamoa dashboard on the web, click the smartphone icon (in the menu bar at the top) and scan the displayed QR code using the Palamoa Android app.
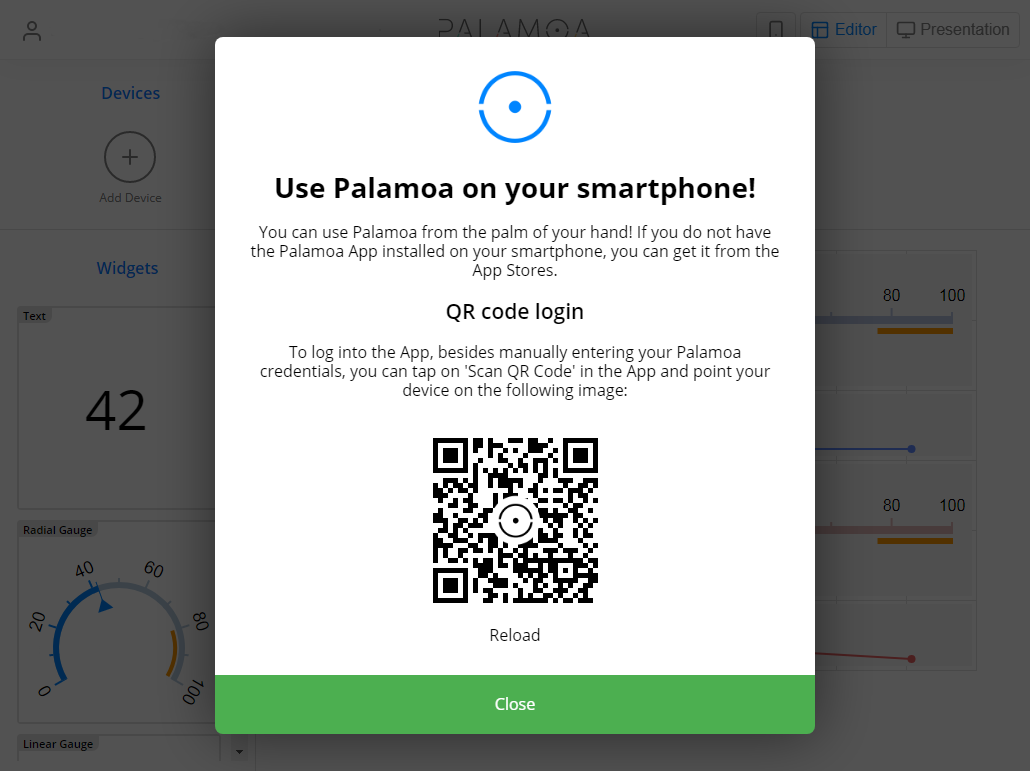
You are now logged into your account on your smartphone and can monitor your values at any time.
About Querx in the Cloud
The Querx network sensors feature a web interface that allows users to access data very easily. It is not generally required to connect the sensors to a cloud service on the web.
Certain conditions that are not always easily established or preexisting are required to access the sensors’ data via the internet, when one is not connected to the local network. Some keywords are static IP-address, dynamic DNS, VPN, NAT and port forwarding.
Many clients would also like to be able to view the data measured by multiple sensors that are located in different places on a single web site.
A cloud offers an alternative that can be configured easily. Querx will periodically send its tracked data to a web server that saves and visualizes the data. Querx has already supported some cloud services, such as Xively, ThingSpeak and dweet.io for a while. Unfortunately, we have had problems with cloud operators changing their service or closing it down entirely in the past. The sale of Xively to Google and displaying data from dweet.io via Freeboard are examples of such issues. Beginning with firmware version 4.2, we have taken a more open approach to cloud integration, supporting the transfer of data to external cloud services that are not directly implemented in the firmware.
Additionally, we envisage a free, independent cloud service provided by egnite. This service is now available and goes by the name Palamoa. The current version is still in its infancy, but already indicates the direction we are headed in. One main focus is customizability without making the configuration too complicated.