Tutorial: Creating graphs with Gnuplot
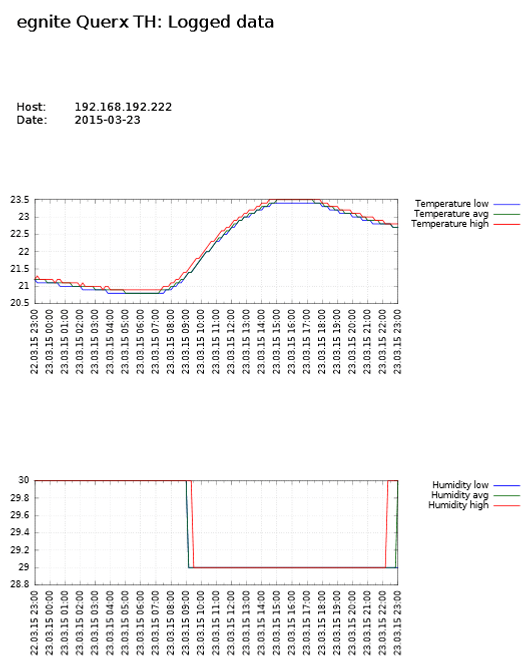
Measurements tracked by Querx throughout the day can be automatically downloaded and visualized in diagnostic graphs with the help of the free application Gnuplot.
This tutorial, which targets the Linux operating system, will show you how to use shell scripts, in order to download the Querx sensor’s measurements in the CSV format and automatically render them in diagrams. A cron job starts this process every morning at 8 AM, processing the previous day’s data.
The data saved by the integrated data logger is accessed via the HTTP interface. The interface’s URL is
http:///tpl/document.cgi?tpl/j/csv.tpl&start=&end=&step=
In this URL is a placeholder for the device’s IP address or hostname. and are placeholders for the Unix-timestamps that indicate the timespan, of which the data is to be downloaded. is the number of seconds between two CSV-entries.
Step 1: Preparation
In addition to the bash, which is available on a Linux system by default, the shell scripts also require the packages wget and gnuplot. Install these with the following command:
$ sudo apt-get install wget gnuplot
Download and unzip the file daily_exports.tar.gz. Then copy the archive’s contents to the home directory of the user querx and assign access privileges to the account. Log into the account querx and continue with the next step.
$ tar -xvzf daily_exports.tar.gz
$ sudo cp -r egnite /home/querx
$ cd /home/querx/
$ sudo chown -R querx:querx egnite
$ cd egnite
$ su querx
Step 2: Managing measuring devices
The tracked measurements differ, depending on the measuring device that is being used, which in turn affects the CSV-files as well as the generated graphs. For this reason, the Querx sensors are grouped into appliance classes. Any Querx TH devices you wish to monitor need to be listed in the file hosts_th, Querx PT devices are listed in the file hosts_pt. Each IP-address or hostname needs to be written in a separate line.
$ cat hosts_pt
192.168.1.100
192.168.1.101
$ cat hosts_th
192.168.1.110
192.168.1.111
Step 3: Customizing the export script
Open the file exports.sh in a text editor such as vim or nano. The following variables determine the script’s behavior: WORKDIR is the directory in which the script is saved. CSVDIR is the directory in which the CSV-files are saved. PDFDIR is the directory in which the generated PDF-files are saved.
WORKDIR='/home/martin/egnite/'
CSVDIR='./csv/'
PDFDIR='./pdf/'
The variables TIME, PERIOD and RESOLUTION determine the CSV-files’ contents: TIME sets the time of the final entry on the day the script is run. PERIOD determines the total number of hours that are to be exported and RESOLUTION sets the time between two entries in minutes.
The following values thus set the script to download the data between midnight on the previous day and midnight on the day the script is run, at an interval of 10 minutes between entries.
#Time of last record in CSV:
TIME="00:00:00"
#Export Period in Hours
PERIOD=24
#Time resolution in minutes
RESOLUTION=10
Step 4: Setting up Gnuplot
After a CSV-file has been downloaded, it is forwarded to the gnuplot_th.sh or gnuplot_pt.sh files, depending on the device class, in order to generate graphs from the data. If you made changes to the export script, it may be necessary to adjust Gnuplot. The command set xtics 3600, for instance, ensures that one step on the graph’s x-axis corresponds to one hour. You can find detailed information on Gnuplot at the project’s website.
Step 5: Configuring the cron job
As a final step, a cron job needs to be configured to execute the script export.sh once a day. Enter the following commands:
crontab -e
If the environment variable EDITOR was not used, you will now need to select an editor. Enter the following command into the editor:
0 8 * * * /home/querx/egnite/export.sh
This command will ensure that the script is executed at 8 AM on every day of the week, in every month and on every day of each month.
Further information on cron jobs can be found in the Ubuntu-Wiki.
The data logged by the specified Querx sensors will now be retrieved at 8 AM every morning, saved in CSV-files in the directory csv and visualized in graphs saved in the directory pdf.